
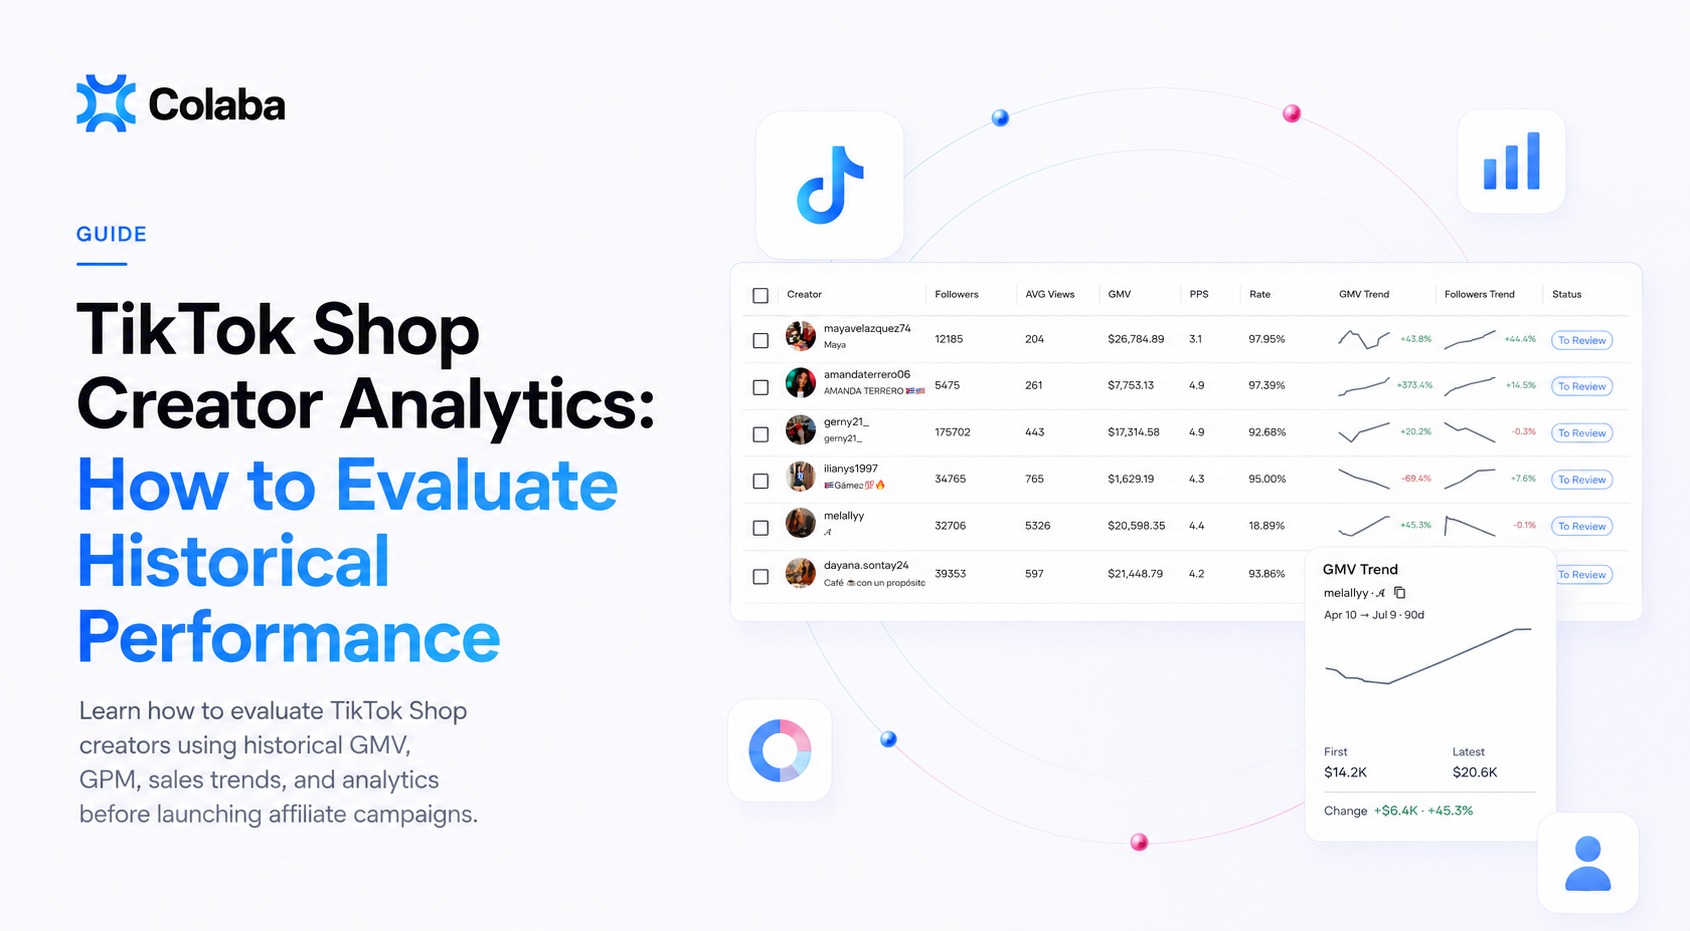
Creator Performance Is a Trend, Not a Static Number
The easiest creator decision is often the least reliable one. A brand opens TikTok Shop, reviews current GMV, units sold, follower count, engagement, and recent activity, then compares creators by what is visible today. Those numbers matter, but they are only a snapshot. They can make proven creators look inactive and spike-driven creators look stronger than they really are.
Snapshot analysis asks, "What does this creator look like today?" Historical analysis asks, "How has this creator performed over time?" That second question is more useful because sampling, outreach, and campaign prioritization all depend on repeatable performance, not one visible moment.
What Brands Should Know Before Evaluating Creators
Why Today's Metrics Don't Tell the Whole Story
Most TikTok Shop creator evaluation begins in the Affiliate Marketplace inside TikTok Shop Seller Center. It is useful for discovery because brands can search, filter, review, invite, and compare affiliate creators already active in the ecosystem.
The limitation appears when discovery metrics are treated as complete history. In many Seller Center views, brands are primarily looking at a recent window, often the last 7 or 28 days depending on the reporting context. That window can show momentum, but not long-term commercial value.
TikTok also maintains official seller education through TikTok Shop Academy. That documentation explains platform workflows, but creator selection still requires broader historical analysis.
A short-term snapshot answers: what is visible now? Historical analysis asks: what has this creator demonstrated over time?
| Visible snapshot | Possible historical reality |
|---|---|
| GMV = $0 Units Sold = 0 |
The creator drove significant sales a few weeks earlier, then paused posting or moved between campaigns. |
| High recent GMV | Performance may come from one viral video, one discount, or one temporary product trend. |
| Low recent activity | The creator may be preparing a new launch, waiting for samples, or shifting category strategy. |
This is where poor creator decisions begin. A short-term snapshot should not be confused with long-term performance. TikTok Shop Seller Center is excellent for discovering creators, but it is not designed for evaluating long-term creator trends.
Historical Data Exists — Brands Just Don't See It
The visibility gap is not caused by missing data. Much of it exists, but it is often more accessible to creators than to the brands evaluating them. TikTok Shop Affiliate Creator Center gives creators a deeper view of their own affiliate activity, earnings, and content performance.
Official affiliate education in TikTok Shop Academy explains affiliate workflows, but creator-side performance history is still not presented to brands as a normalized, comparable database.
A brand may see a narrow recent window while the creator sees a broader record: historical GMV, commissions, product clicks, affiliate videos, and previous campaign results. Both parties are looking at TikTok Shop data, but not at the same depth of history.
Experienced creators often send Creator Center screenshots to prove performance that brands cannot see, including prior campaign GMV, commissions, clicks, or sales outside the current Seller Center view.
Creator Center can help creators prove their history, but screenshots are not a scalable analytics workflow for brands.
| At small scale | At database scale |
|---|---|
| A creator sends a screenshot to support a campaign discussion. | Hundreds of screenshots arrive in different formats, date ranges, and levels of detail. |
| The brand can manually review one creator's proof. | The team cannot verify, normalize, and compare every creator consistently. |
Creator Center gives creators useful history, but brands still lack an efficient way to analyze it across large databases. That gap creates the need for searchable, comparable creator analytics.
How to Analyze Creator History Like a Professional
Creator history is multidimensional. Sales history, audience growth, publishing behavior, product fit, brand history, and monetization efficiency each answer a different business question.
Professional analysis does not look for one perfect number. It combines multiple signals into one historical view.
Key metrics defined
| Metric | Definition | Why it matters |
|---|---|---|
| GMV | Gross merchandise value attributed to a creator's affiliate activity during a defined period. | Shows revenue scale, but needs historical context to separate durable sales from one-time spikes. |
| GPM | A monetization efficiency metric commonly used to compare revenue generated per thousand views or traffic events, depending on reporting context. | Helps brands compare creators with different audience sizes and posting volumes. |
| Video GPM | GPM for short-form affiliate video performance. | Shows whether product videos convert attention into revenue efficiently. |
| LIVE GPM | GPM for livestream commerce performance. | Shows whether live selling sessions are converting viewers into buyers. |
| Dimension | Metrics to review | What it helps identify |
|---|---|---|
| 1. Sales Performance History | GMV, Units Sold, GMV Per Customer, Video GPM, LIVE GPM | Sustainable growth, temporary spikes, declining performance, stable revenue, higher-value customers, and stronger monetization. |
| 2. Audience Growth History | Followers Trend | Whether reach is growing with sales, growing without sales, declining, or staying stable while monetization improves. |
| 3. Content Activity History | Videos, EC Videos, LIVE Videos, EC LIVE Videos | Posting frequency, shopping-content adoption, LIVE commerce investment, inactive periods, and consistency over time. |
| 4. Product Portfolio History | Products promoted | Specialization, diversification, category expansion, and long-term product focus. |
| 5. Brand Collaboration History | Collaborated Brands | Past brand relationships, recurring collaborations, best-performing categories, and repeated success in specific verticals. |
| 6. Monetization Efficiency History | GPM, Video GPM, LIVE GPM | Whether the creator converts attention into revenue efficiently, not just whether total GMV looks large. |
How to evaluate a creator in 5 steps
| Step | What to check | Decision question |
|---|---|---|
| 1. Start with sales history | Historical GMV, Units Sold, and GMV Per Customer. | Has this creator sold consistently, or is performance concentrated in one period? |
| 2. Compare audience and sales | Followers Trend alongside GMV and GPM. | Is audience growth translating into commercial performance? |
| 3. Review publishing behavior | Videos, EC Videos, LIVE Videos, and EC LIVE Videos. | Is performance supported by consistent output or isolated activity? |
| 4. Check commercial fit | Products promoted and Collaborated Brands. | Does the creator have relevant category experience for this catalog? |
| 5. Validate efficiency | GPM, Video GPM, and LIVE GPM. | Does the creator convert attention into revenue efficiently enough to justify priority? |
Example creator scorecard
| Signal | Strong pattern | Caution pattern |
|---|---|---|
| Sales | GMV and Units Sold remain stable or improve across multiple periods. | Sales depend on one month, one product, or one viral post. |
| Audience | Followers Trend supports sales growth or better monetization. | Followers grow while commerce performance stays flat. |
| Content | Publishing cadence and EC content remain consistent. | Long inactive periods or irregular commerce posting create uncertainty. |
| Fit | Product and brand history match the campaign category. | Frequent category changes make product-market fit unclear. |
| Efficiency | GPM, Video GPM, or LIVE GPM remain stable across time. | High GMV appears with weak efficiency or heavy dependence on reach. |
No single metric tells the full story. Strong creator decisions combine sales history, audience growth, publishing behavior, product portfolio, brand relationships, and monetization efficiency into one historical view. That is how brands distinguish temporary momentum from durable creator performance.
Historical Patterns Every Brand Should Recognize
Historical metrics become useful when brands recognize patterns, not isolated numbers. A low-GMV creator may be declining, seasonal, sleeping, or simply between campaigns. A high-GMV creator may be growing steadily or benefiting from one viral moment.
| Pattern | What brands should look for | How to interpret it |
|---|---|---|
| Growing | Rising GMV, sales volume, GPM, and consistent output. | Potential long-term partner with improving commercial quality. |
| Stable | Predictable GMV, steady posting, reliable monetization. | Often more useful than spike-driven creators for recurring campaigns. |
| Seasonal | Performance tied to holidays, launches, gifting, or category cycles. | Declines may reflect timing, not creator weakness. |
| Sleeping | Low current GMV but strong prior sales and efficiency. | Potential overlooked opportunity if reactivated with the right offer. |
| Declining | Weakening GMV, publishing, engagement, and monetization. | Warning sign when several signals decline together. |
| One-hit | High recent performance concentrated in one post or campaign. | Needs validation before being treated as a repeatable seller. |
The practical value is prioritization. Growing creators may deserve earlier outreach, stable creators may support recurring campaigns, seasonal creators need better timing, sleeping creators may be worth reactivation, declining creators require caution, and one-hit creators need validation before a brand treats them as repeatable sellers.
The Most Common Mistakes Brands Make
Brands misjudge creators when they treat the easiest metrics as the most reliable ones. A 7 to 28 day window can show current activity, but it rarely represents long-term value. Current GMV, follower count, and one viral campaign should be inputs, not final judgments.
The strongest warning signs are repeated: ignoring historical trends, confusing reach with buyer intent, overlooking GPM, and missing creator consistency. Teams that want to Automate TikTok Shop Affiliate Outreach still need historical context before sampling, outreach, or campaign decisions.
How Colaba Makes Historical Creator Analysis Practical
The challenge is not understanding that history matters. The challenge is doing it efficiently. Seller Center is useful for discovery, but its limited reporting window makes long-term evaluation difficult across hundreds or thousands of creators.
As a TikTok Shop Affiliate Management Software, Colaba helps brands compare long-term creator performance instead of relying only on current metrics.
Colaba helps brands compare creators through historical trends, not only through the limited 7 to 28 day reporting window available in TikTok Shop.
Historical GMV, Exact Units Sold, GMV Per Customer, Followers Trend, product history, Collaborated Brands, GPM, Video GPM, and LIVE GPM help teams see who sells, who sells efficiently, and whose category history fits the campaign.
| Analysis need | How Colaba supports it |
|---|---|
| Find rising creators | Compare historical GMV, Units Sold, Followers Trend, and improving GPM over time. |
| Identify stable performers | Review consistent sales, steady publishing signals, recurring brand relationships, and reliable efficiency. |
| Understand seasonal creators | Look at historical performance across product categories, gifting periods, launches, and demand cycles. |
| Spot recovering creators | Use historical sales and product data to see whether a creator is returning after an inactive period. |
| Find overlooked opportunities | Identify creators with low current visibility but strong historical GMV, GPM, or category fit. |
Colaba helps brands make creator decisions based on long-term historical patterns rather than the limited 7 to 28 day reporting window available in TikTok Shop.
Best Practices for Historical Creator Analysis
Historical analysis should be part of creator selection, not an optional extra step. Before launching a campaign, brands need a fast way to check whether a creator's past performance supports the campaign goal.
| Checklist item | Why it matters | What to look for |
|---|---|---|
| GMV trend | Shows whether creator sales are growing, stable, seasonal, declining, or spike-driven. | Look for repeatable sales across time, not only one strong recent campaign. |
| Followers trend | Reveals whether audience growth supports commercial performance. | Compare follower movement with GMV, Units Sold, and monetization efficiency. |
| Units Sold | Separates revenue value from order volume. | Check whether demand is broad and repeatable or tied to a few high-value purchases. |
| Brand history | Provides context on prior partnerships and category credibility. | Look for repeated collaborations, relevant verticals, and brands similar to your own. |
| Product history | Shows what the creator has actually promoted and where they have category fit. | Review whether the creator specializes, diversifies successfully, or changes focus too often. |
| GPM | Measures how efficiently the creator turns traffic into revenue. | Look for stable or improving efficiency, especially across multiple products. |
| Video GPM | Shows short-form affiliate video monetization quality. | Check whether videos convert consistently or depend on isolated viral reach. |
| LIVE GPM | Shows how effectively live commerce converts attention into sales. | Review whether live performance supports launches, demos, bundles, or promotion periods. |
| Publishing activity | Explains whether performance is supported by consistent output. | Look at Videos, EC Videos, LIVE Videos, inactive periods, and publishing rhythm. |
| Seasonal changes | Prevents brands from misreading normal demand cycles as creator weakness. | Compare performance across holidays, gifting periods, launches, and category seasons. |
The goal is not to find perfect creators. The goal is to understand each creator's real performance pattern before deciding how to work with them.
Conclusion
The best creator partnerships aren't built on today's metrics. They're built on understanding how a creator has performed over time. Current GMV, Units Sold, and follower count can start the evaluation, but they should not end it.
Historical creator analysis helps brands avoid short-term mistakes, interpret seasonality, identify overlooked creators, and avoid overvaluing one viral campaign. That matters because every sample, invitation, collaboration, and campaign slot carries an opportunity cost.
A stronger workflow combines historical GMV, Units Sold, Followers Trend, product history, brand collaborations, GPM, Video GPM, LIVE GPM, and publishing activity into one view. It does not remove judgment; it gives judgment better evidence.
After a brand understands how to evaluate creator history, the next step is building a broader TikTok Shop growth system around creator discovery, outreach, sampling, campaign structure, and performance optimization. For that wider strategy, read How to Scale TikTok Shop with Influencer Marketing: 2026 Strategy Guide.
Frequently Asked Questions
Scale TikTok Shop Creator Outreach With Colaba
As a TikTok Shop Creator Outreach Platform, Colaba helps sellers, brands, and agencies manage creator discovery, outreach, senders, deliverability, and campaign visibility in one workflow.